Team Howe at Compass

San Francisco, one neighborhood at a time

Ten Realtor districts. Eighty nine subdistricts. Seven miles by seven miles of hills, fog lines and street grids that change character in a single block. Start on the map.

San Francisco changes in a single block. One street is under fog by two in the afternoon and the next one over is in full sun. One block has garages, the one behind it has a permit line and a hill you would not want to carry groceries up. Ten Realtor districts, eighty nine subdistricts, and not one of those numbers tells you how a place feels on an ordinary Tuesday.

So start with the map. Click any neighborhood and you get what homes there actually sold for, how fast they sold, how far you can get on foot and on Muni, what the weather really does there, and a short honest read on what living there is like. Then tell us what matters most to you, whether that is sun, a garage, or a commute you can live with. Narrowing eighty nine down to the one that fits you is the part we are good at.

The ten districts, and every subdistrict inside them The full Realtor vocabulary your agent, the appraiser and the other side of the deal will all be using, with a median for each of the 89 subdistricts. Open the listClose the list

It is worth knowing which one your block sits in. Click any subdistrict to open it on the map. Medians are rolling six month figures from the San Francisco MLS.

Questions people ask about San Francisco neighborhoods

Short answers, taken from the same figures the map above is drawn from.

How many neighborhoods does San Francisco have?

The San Francisco MLS divides the city into ten Realtor districts and 89 subdistricts, and those are the names on every listing, every appraisal and every contract. People who live here name a good many more than that, and the two vocabularies do not always agree. The map on this page draws all 89, plus Golden Gate Park, the Presidio and Lincoln Park, which are open space rather than subdistricts.

What is the median home price in San Francisco right now?

$1,600,000 across the county, on a rolling six month window through August 2026, which is up 14.3% against the same window a year earlier. The median price per square foot is $1,143 and the median home takes 14 days to sell. Those are all property types together; a single subdistrict can sit a long way either side of the citywide number.

Which San Francisco neighborhood is the most expensive?

Sea Cliff, at a $5,425,000 median over the rolling six months through August 2026, and $1,965 per square foot, which is the highest in the city. Presidio Heights is second.

Which San Francisco neighborhood is the most affordable?

Tenderloin, at a $518,800 median, followed by Downtown at $585,000. Both are almost entirely condominiums and apartments, so the figure says more about what is being sold than about what a square foot costs.

Which San Francisco neighborhoods get the most sun?

Measured over the last 24 months, the sunniest are Visitacion Valley, Hunters Point, Bayview Heights, all around 8.4 hours of sunshine a day. The foggiest are Outer Parkside and Lake Shore, at about 5.8. That gap is two and a half hours a day and roughly seven degrees on a summer afternoon, which is why the weather layer on this map is worth a look before you commit to a side of town.

Which San Francisco neighborhoods are the most walkable?

By Walk Score, Tenderloin at 100, Mission Dolores at 99, Hayes Valley at 99, Downtown at 99. The map's Walk Score layer shades all 89 subdistricts, and the panel gives Transit and Bike Scores alongside.

What is a Realtor district, and why does it matter when I buy or sell?

It is the MLS's own map of the city: ten districts, each split into subdistricts with codes like 5C or 10A. Comparable sales are pulled by subdistrict, appraisers work in them, and search filters are built on them. If your block sits on the edge of one, the comps your agent pulls and the comps the other side pulls can come from two different sets of houses, and that is worth knowing before either of you names a number.

How often are the figures on this page updated?

The market figures are a rolling six month window from the San Francisco MLS, current through August 2026, and we refresh them about every six months. Walk, Transit and Bike Scores come from Walk Score. The microclimate figures are 24 month averages from Open-Meteo's high resolution model and move slowly enough that once a year is plenty.

Team Howe at Compass

Pick the neighborhood before you pick the house.

If you are thinking about buying or selling in San Francisco, Team Howe can help you understand your options, evaluate the local market, and make a clear plan. Contact us to start a conversation.

Agent

Sherri Howe, REALTOR®
Founder, Team Howe | Compass

License

CA DRE #01816621

Phone

(415) 640-4664

Email

[email protected]

Office

3512 16th Street
San Francisco, CA 94114

Where these numbers come from

  • Market data. San Francisco MLS, through the SFAR MarketStats service. Median sale price, median price per square foot, median days on market, closed sales, active listings and months supply are rolling six month figures for each Realtor subdistrict, current through August 2026. Rolling six months is the window MarketStats reports on, and it is short enough that a subdistrict with only a handful of sales a year still reflects this year rather than last. We refresh these figures about every six months, and the date above always says which pull you are looking at.
  • District and subdistrict boundaries. Traced from the San Francisco Association of Realtors neighborhood map, the one with the ten districts and the 89 subdistricts. Every subdistrict is drawn as a single closed area that meets its neighbors with no gaps and no overlaps, and the whole set covers the city. Golden Gate Park, the Presidio and Lincoln Park are drawn the same way.
  • Walk Score, Transit Score and Bike Score. Walk Score®, taken for the Walk Score area that covers each subdistrict. Where one published Walk Score area covers more than one subdistrict, the panel says which area the figures belong to.
  • Microclimate. Average daily high, average daily low and elevation at the center of each subdistrict, from Open-Meteo's high resolution historical model, averaged over the 24 months from September 2024 through August 2026. San Francisco runs about seven degrees warmer on a summer afternoon in the Mission than it does out at Forest Hill, and this is the layer that shows it.
  • Population. Walk Score neighborhood profiles, where published.
  • The three open spaces. Golden Gate Park, the Presidio and Lincoln Park carry no sale figures, because nothing inside them changes hands. They do carry Walk, Transit and Bike Scores and a microclimate, measured at the middle of the park, and they name the Realtor districts whose blocks run up against them.

Medians in small subdistricts move a lot on a handful of sales, so the closed sales count is shown next to every median. Market figures are historical and are not a prediction of what any particular home will sell for. Golden Gate Park, the Presidio and Lincoln Park are drawn in gray on the layers that are about selling, because nothing inside them sells. They are shaded like everywhere else on the Walk Score, Transit Score and weather layers, and they open a card of their own. Team Howe at Compass. Compass is a licensed real estate broker. Information is compiled from sources deemed reliable but is not guaranteed.


Schools in Silver Terrace, CA

All ()
Primary Schools ()
Middle Schools ()
High Schools ()
Mixed Schools ()
The following schools are within or nearby Silver Terrace. The rating and statistics can serve as a starting point to make baseline comparisons on the right schools for your family. Data provided by the U.S. Census Bureau.
Type
Name
Category
Grades
School rating

Around Silver Terrace, CA

There's plenty to do around Silver Terrace, including shopping, dining, nightlife, parks, and more. Data provided by Walk Score and Yelp.

78
Very Walkable
Walking Score
65
Bikeable
Bike Score
72
Excellent Transit
Transit Score

Points of Interest

Explore popular things to do in the area, including Naser Mini Mart, Tea Plus, and Butchertown Coffee.

Name Category Distance Reviews
Ratings by Yelp
Dining 0.35 miles 0 reviews 0/5 stars
Dining · $ 0.37 miles 172 reviews 3/5 stars
Dining 0.46 miles 26 reviews 4.5/5 stars
Dining · $$ 0.47 miles 14 reviews 2.4/5 stars
Dining 0.59 miles 0 reviews 0/5 stars
Dining 0.63 miles 3 reviews 4.3/5 stars

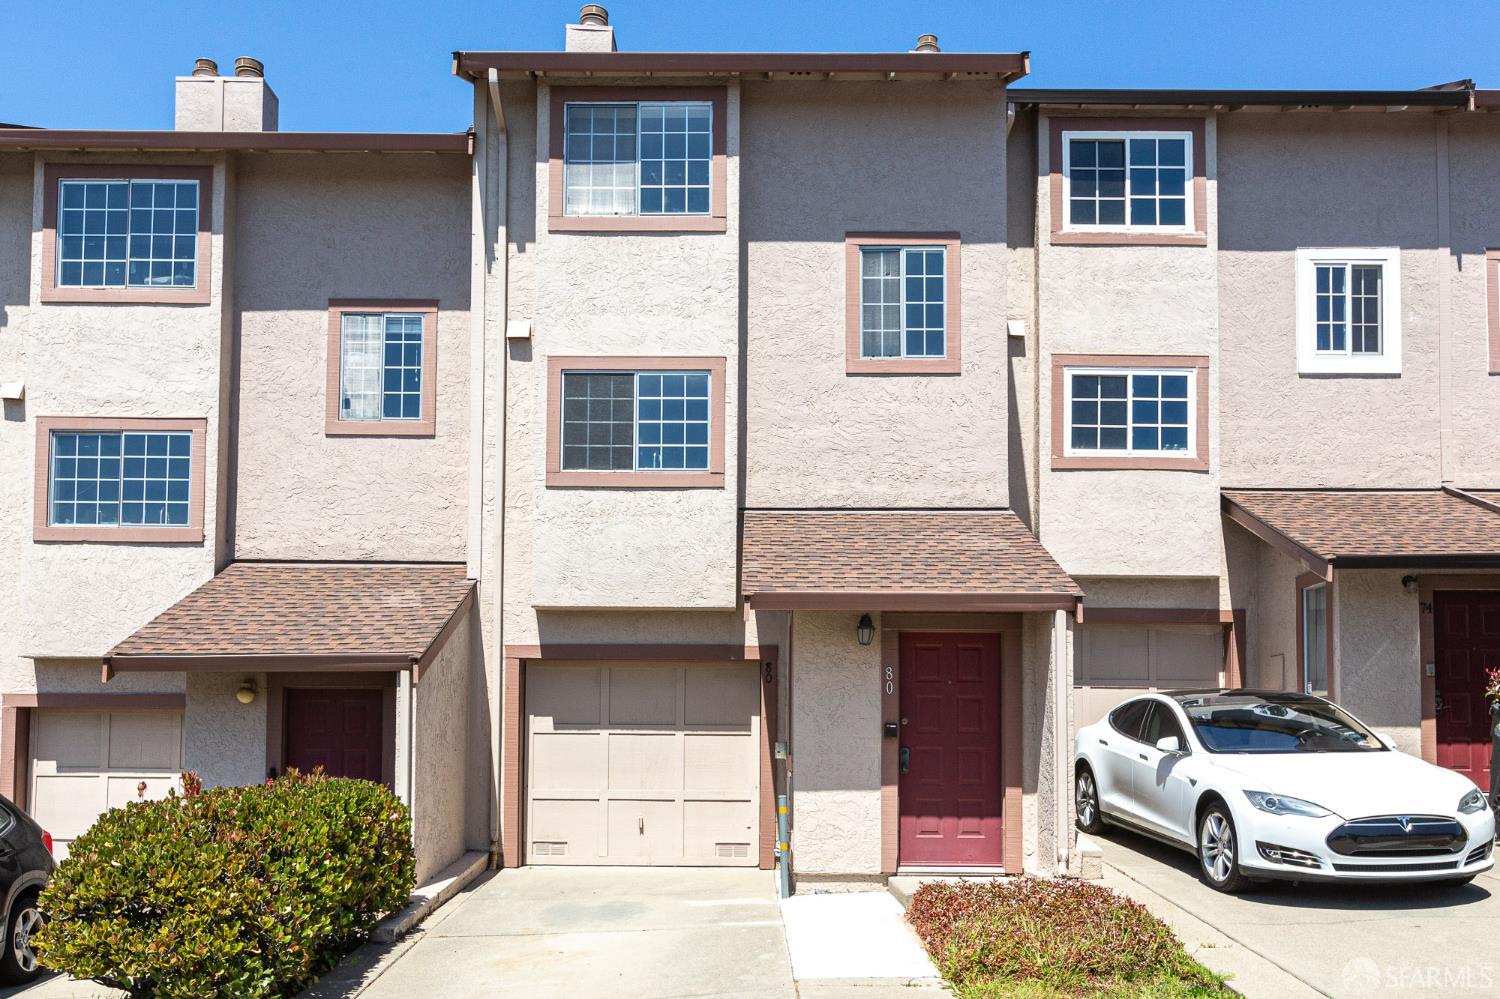
Properties in the Area